Unlock market clarity, confidence, and context. It’s time to see the global markets.
Comprehensive Market Regime Data:
Dive deeper, see clearer, understand better
Analyze and visualize market structure with speed, clarity, and actionable precision. Clearly and confidently guide your clients to higher ground during times of market volatility. Guard their savings and maximize their returns during all market regimes.
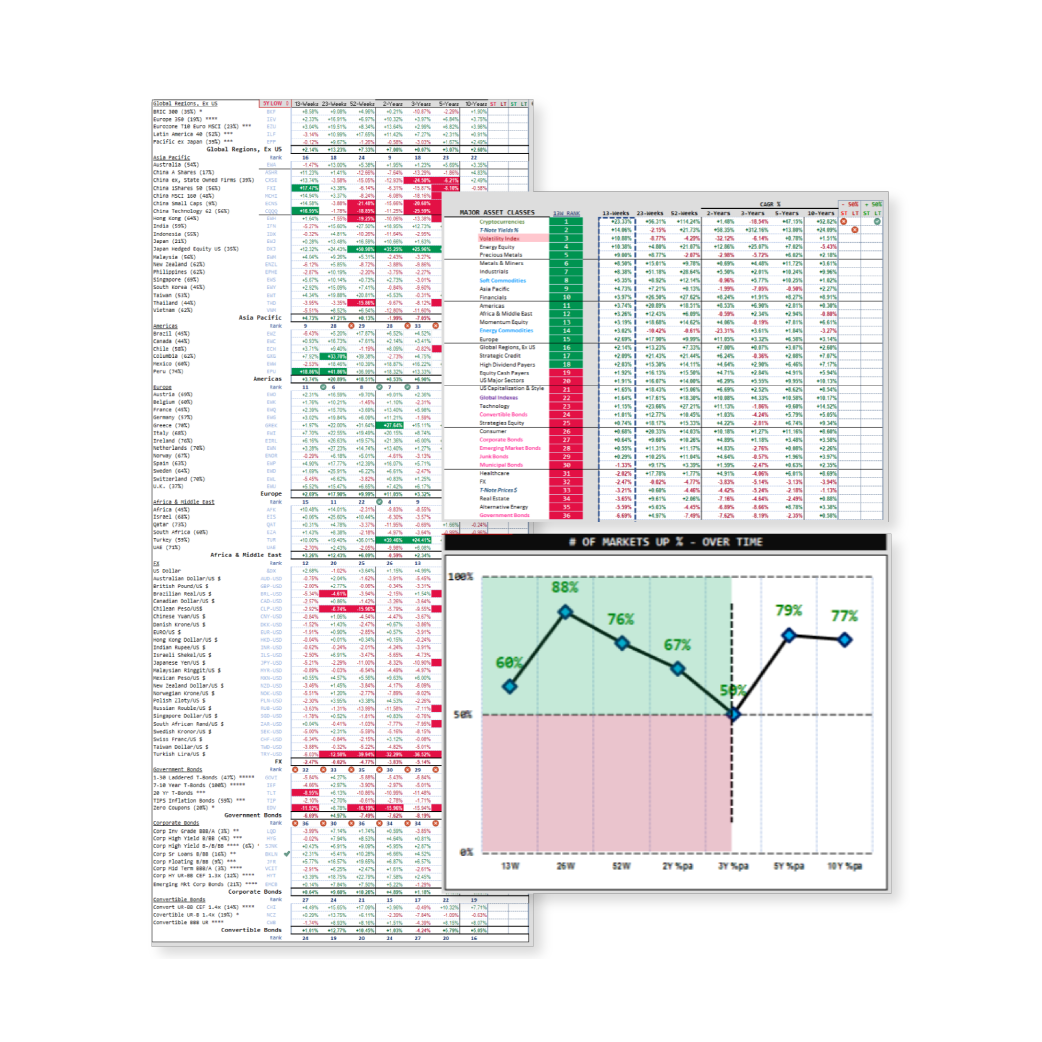
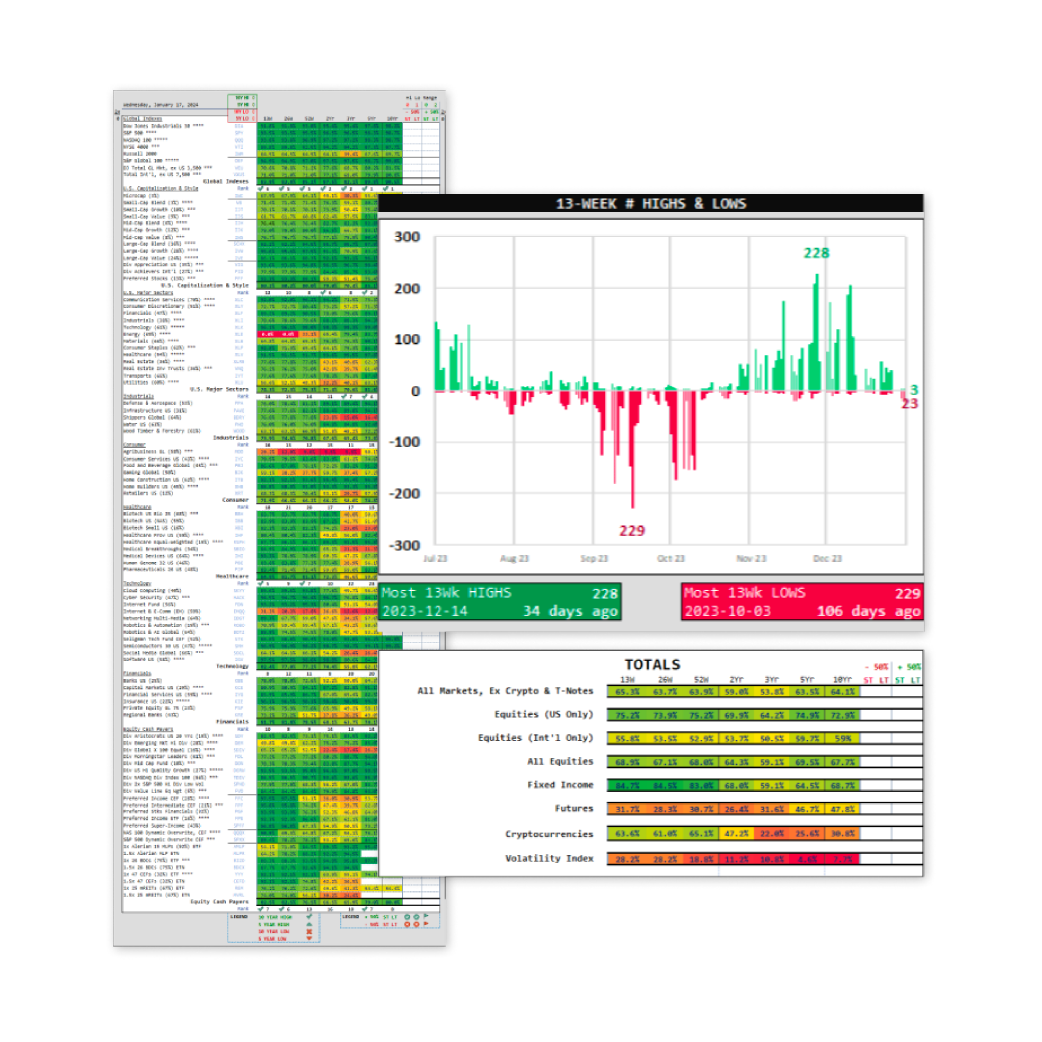
Our proprietary algorithm uses weighted dimensions and criteria from over 360 global markets and 150+ daily market indicators—synthesized into color-coded dashboards that are tracked and updated daily. See market movements clearly, in a glance.
Deep-Dive Market Insights:
See micro movements in macro regimes
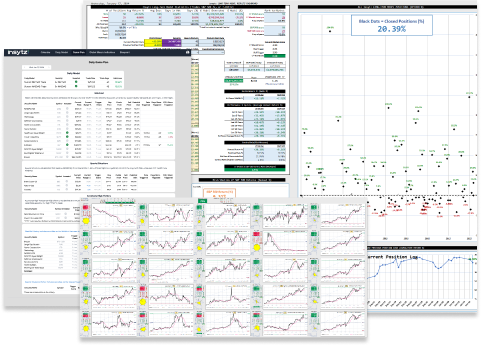
See what other professional investors miss. Our proprietary algorithm empowers you to explore data from high-level overviews down to the finest detail. insytz equips serious investors with advanced data overviews, visualizations, and insights that go deeper.
Weighted dimensions & criteria
Harness sophisticated market evaluation and precise analysis using insytz’s unique dimensions and criteria.
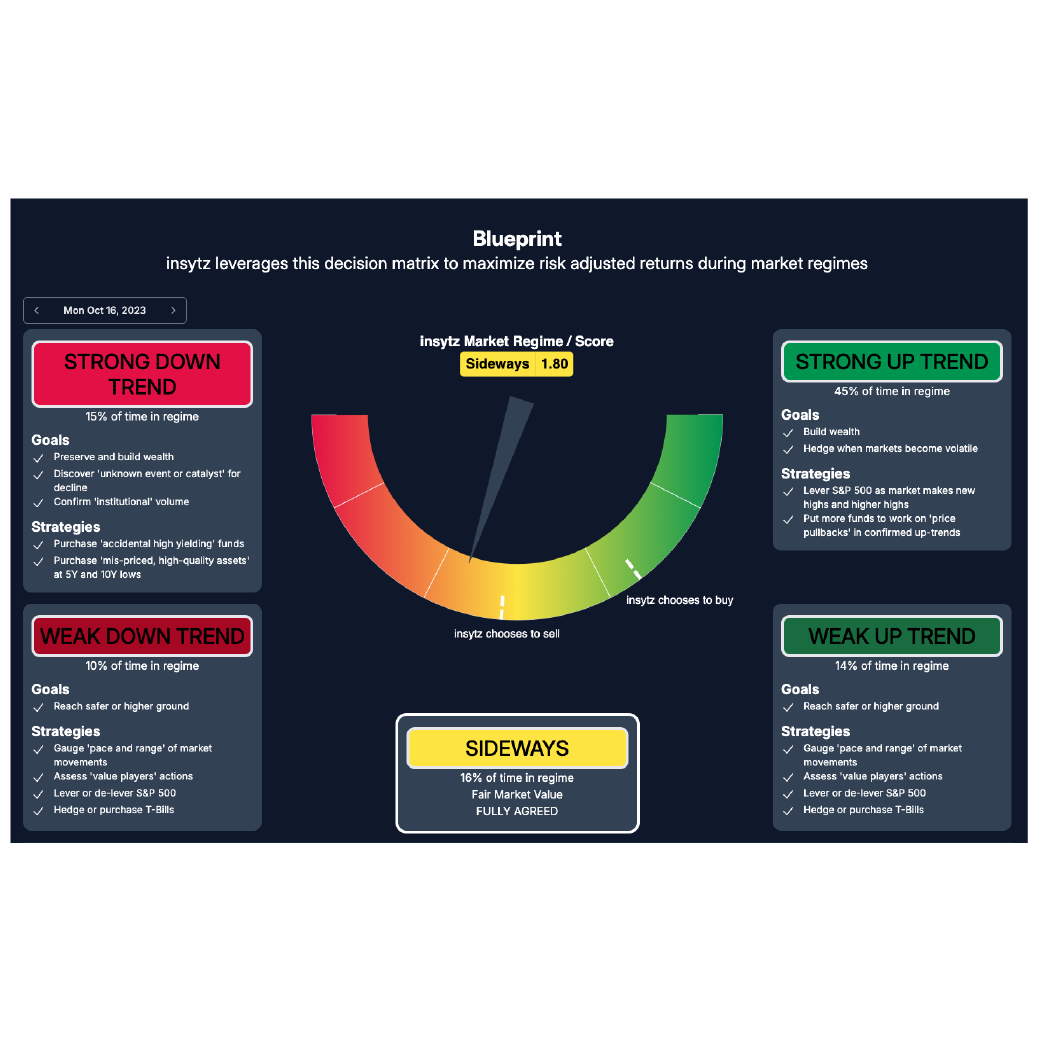
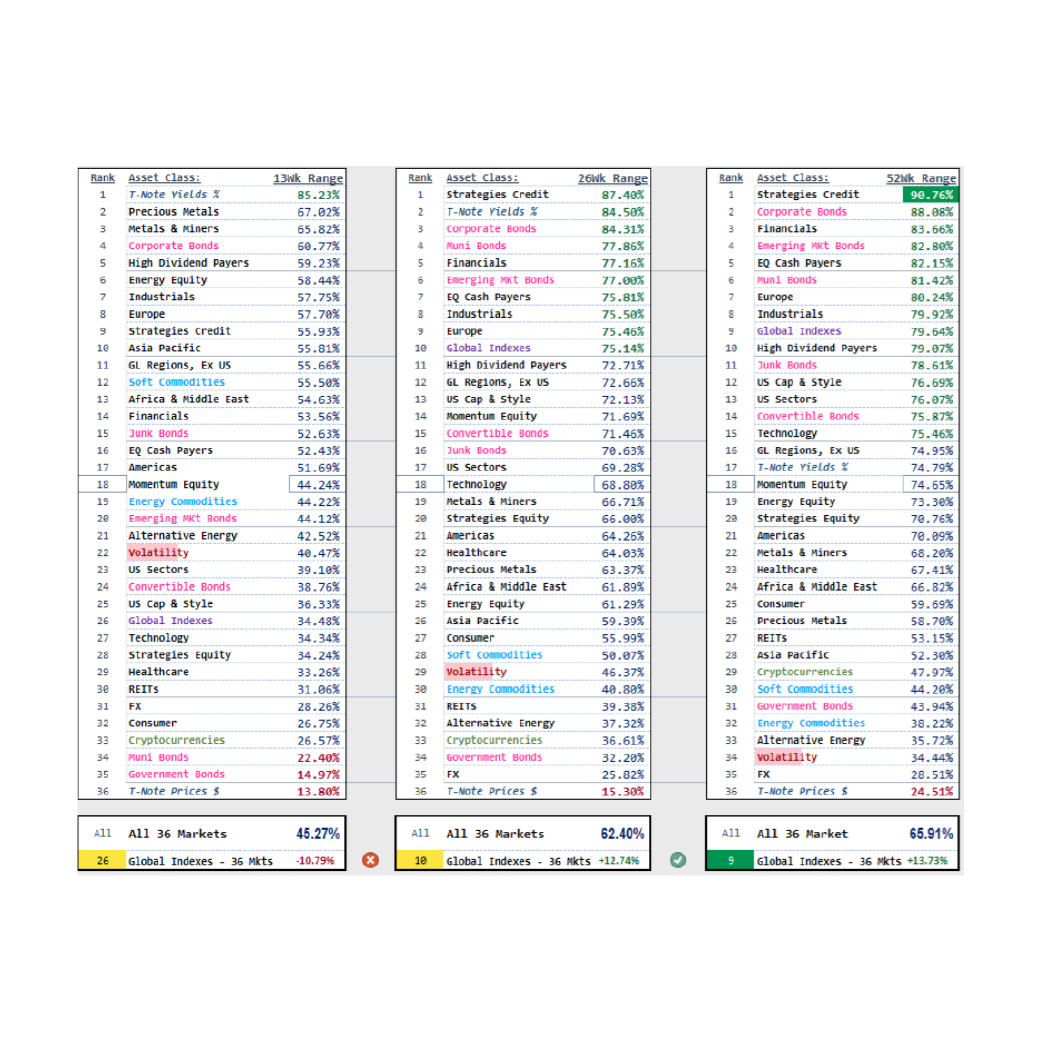
Weighted Market Regime Scoring
Market Ranking and Conditions based on 80 years of historical data
Market Range Direction
Market Trend Score vs. Trend / Range Expansion
Market Range Expansion Percentage vs. Trend
S&P Volume Ratio
Market Trend Change
S&P 13-week and 52-week Highs vs. Lows
S&P vs. Volatility Ratio Number and Rank Percentage
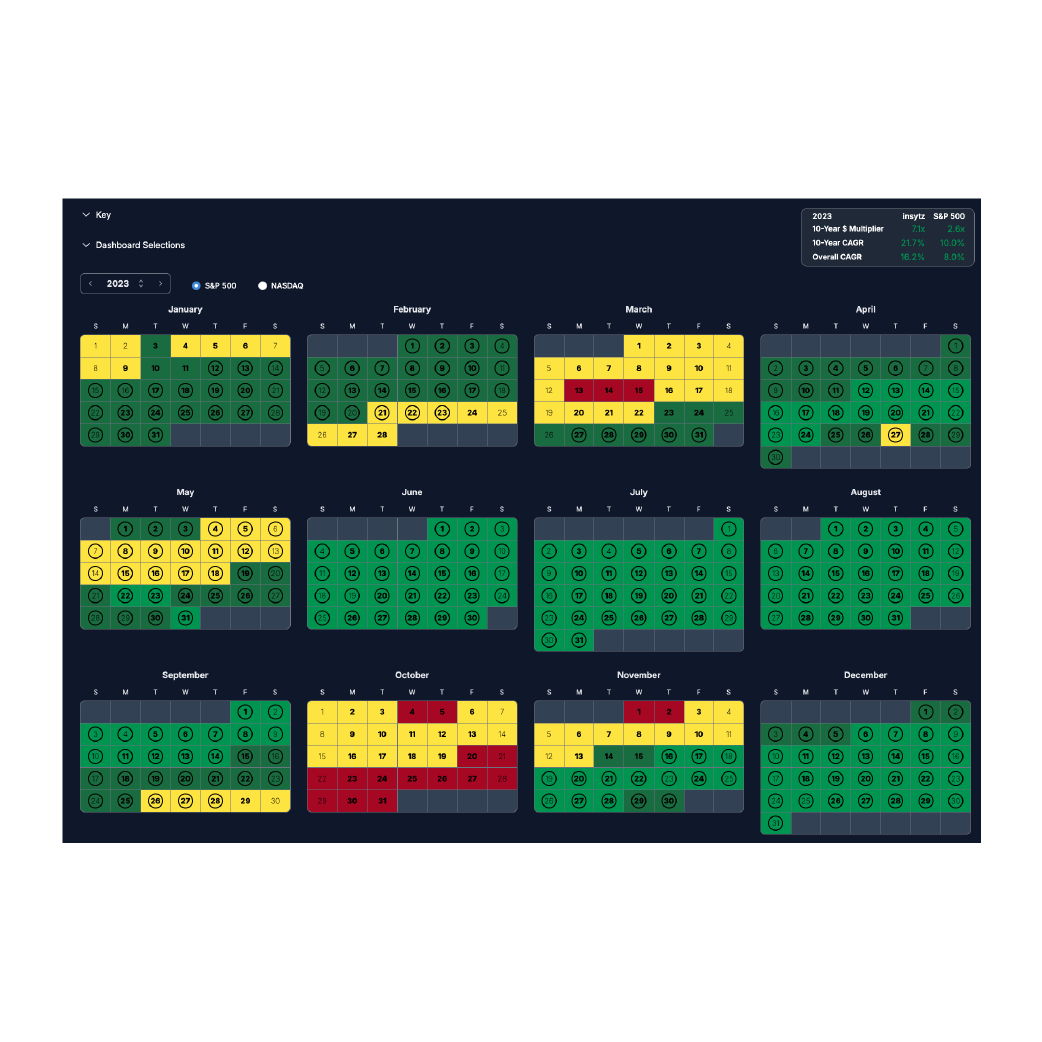
Consistently higher risk-adjusted returns vs. S&P 500 B&H
Achieve superior risk-adjusted returns that consistently outperform the S&P 500 Buy and Hold results.
21.5% Average Annual Return
-+12% Higher Per Year than S&P 500 Buy and Hold
2.05 Sortino Ratio
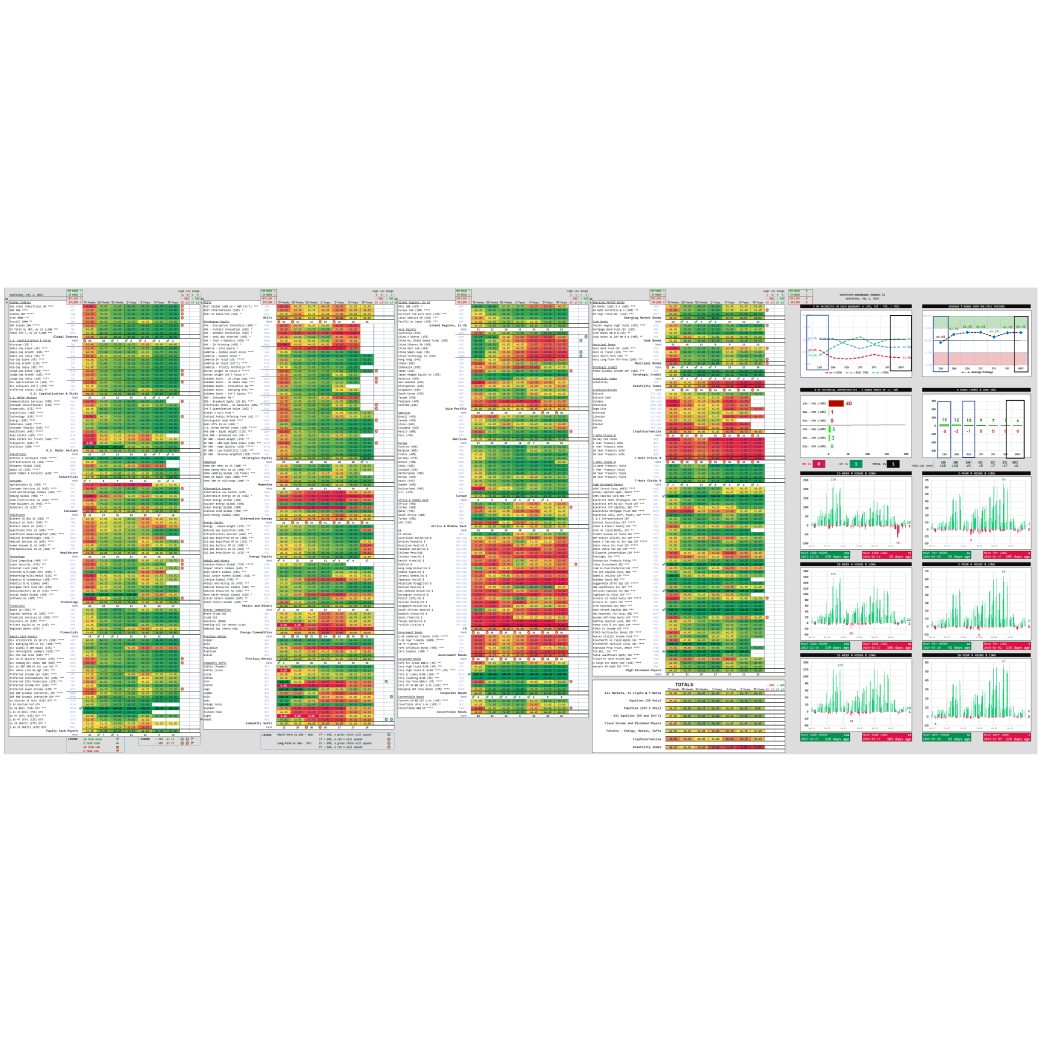
Comprehensive observation of the Global Ecosystem
Gain an overarching view of global market dynamics that goes beyond the basics with real-time, in-depth data tracking and analysis.
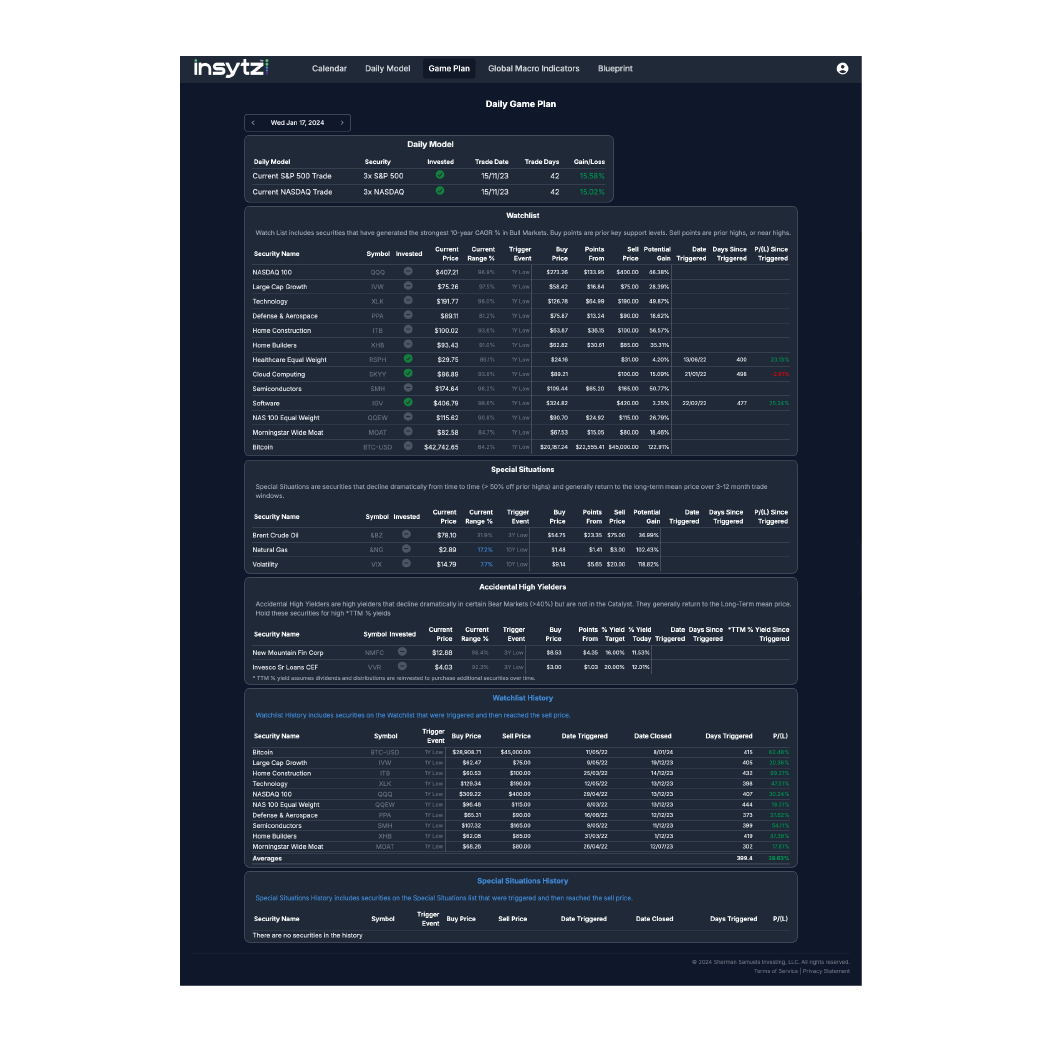
insytz displays where investors moved, where they are moving now, and how fast
Easy, rapid, real-time critical market movement detection
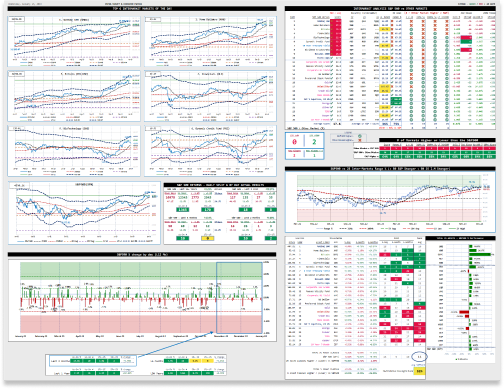
Key analysis of over 150 global macro indicators and KPIs in a single report, tracked and updated daily
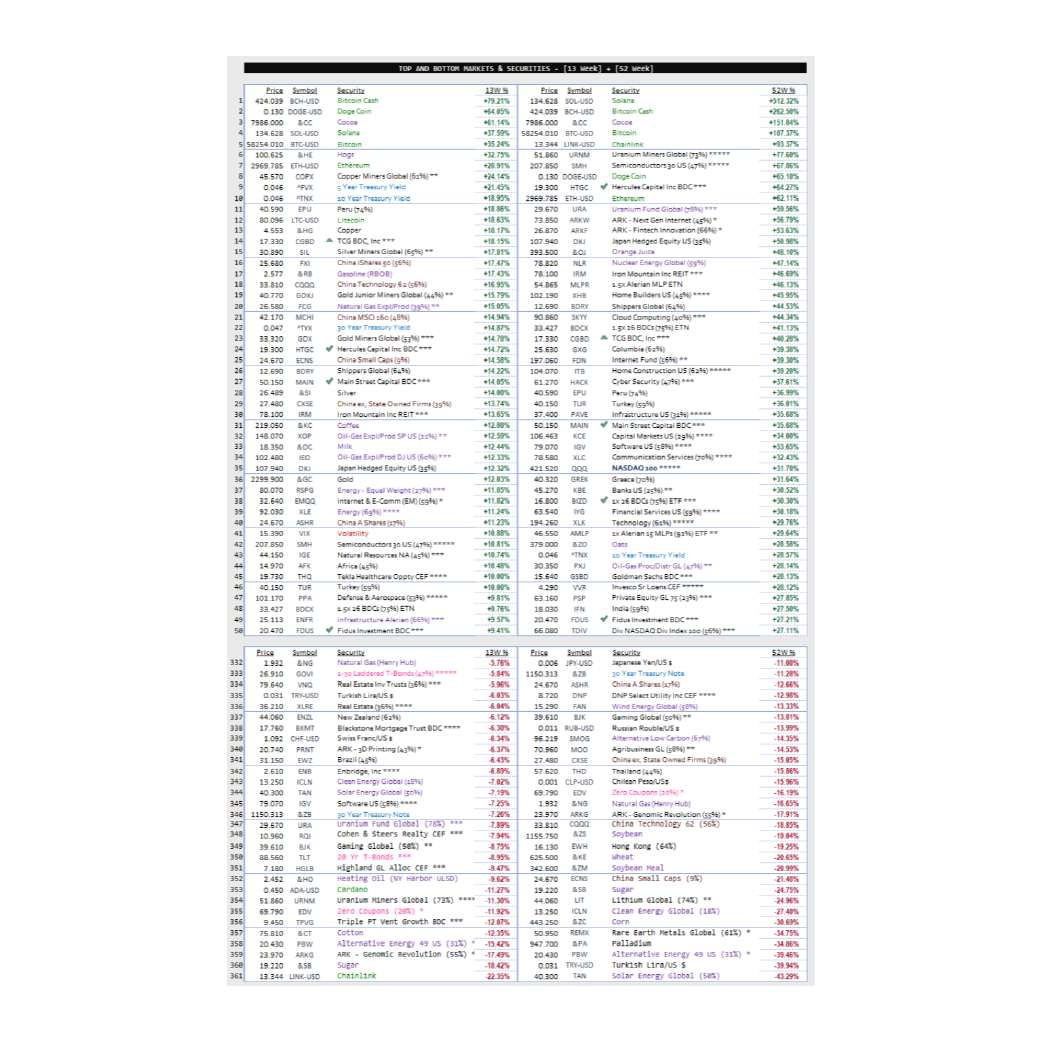
Actionable Scoring for Market Mispricing, Overreactions, and Opportunities
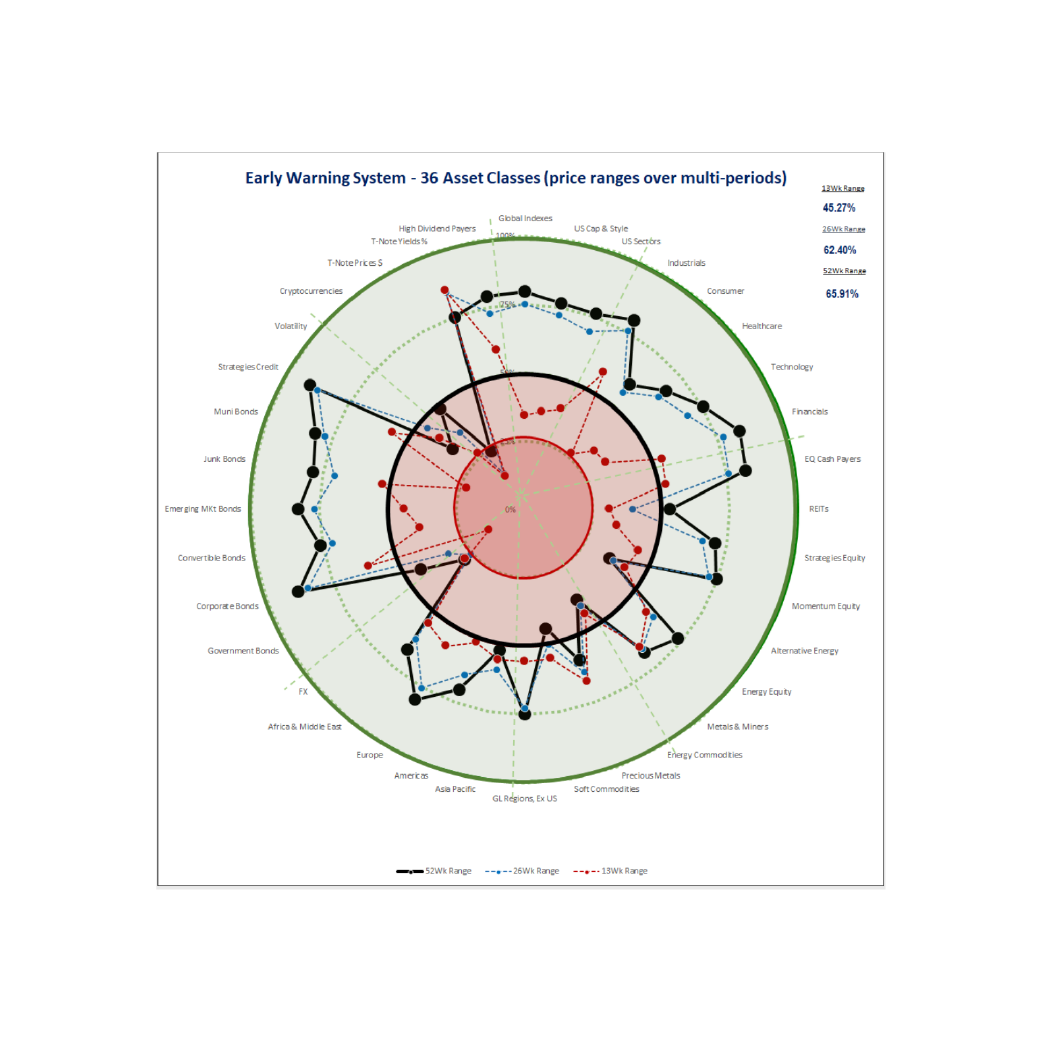
Unlock granular insights that unveil market mysteries with visuals that empower serious investors to act on emerging opportunities with precision, speed, and confidence.
Context for targeted research on global-macro shifts
Immediate identification of “moment-in-time” movements
Proprietary weighted scoring mechanism for inter-market ratios analysis
Comprehensive visualization of 25 inter-markets, displaying real-time asset class movements